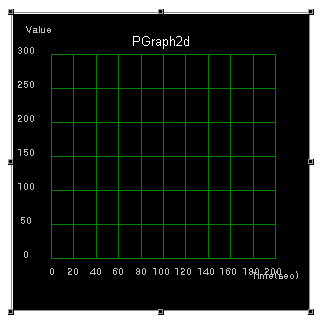

Using this component, you can monitor the history of device value.
Note : This graph will update its shape when it receives a value. (in
HD1100 and HD1200, it will update its shape periodically. The period of update
is 'Device polling period' property. When use in HD13xx, it will not update its
shape periodically. It will update its shape only when it receives a data.
Note : This component will not remember or hard-record full history data.
The old data which has squeezed out from this graph will be lost.
 |
 |
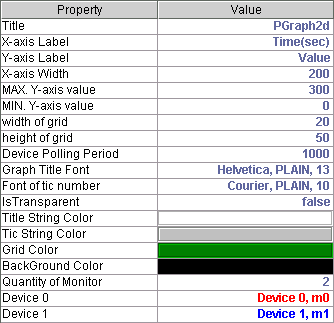
Title : the title of this graph
X-axis Label : the label of x-axis
Y-axis Label : the label of y-axis
X-axis Width : the range of x value (x-value is time in second and the
range will be zero to this value)
MAX. Y-axis value : the maximum value that this graph can display
MIN. Y-axis value : the minimum value that this graph can display
width of grid : the grid width of this graph
height of grid : the grid height of this graph
Device polling period : time period of device monitoring (1100 and
1200 / expert feature)
Graph Title Font : font, style and size of the title of this graph
Font of tic number : font, style and size of scale numbers of this graph
IsTransparent : is the background of this component transparent?
Title String Color : the color of this graph's title
Tic String Color : the color of scale numbers
Grid Color : the color of this graph's grid lines
BackGround Color : the color of this component's background
Quantity of Monitor : the quantity of values that this graph will monitor
(the maximum quantity of monitor is 10)
Device # : monitoring value setup (name and value expression of each
monitor)